API Rate Limit Checker: Debugging and Managing Consumption at Scale

Last Updated on September 10, 2026 by Triumphoid Team
Your automation isn’t truly scalable if it’s one burst away from a 429 “Too Many Requests” meltdown. You’ve likely spent hours parsing inconsistent header data or manually guessing when a reset window actually closes. It’s a frustrating, error-prone cycle that turns a simple integration into a debugging nightmare. We understand the struggle of managing unpredictable workflow crashes when SaaS providers move the goalposts on their limits. Using a dedicated api rate limit checker is the only way to move from reactive patching to proactive scaling. Manual testing is too slow and your production environment is too valuable to use as a laboratory.
We’re going to fix that. This guide provides a professional-grade framework to master your consumption and eliminate 429 errors for good. You’ll learn how to simulate load and verify rate limit thresholds using a browser-based testing framework designed for practitioners. We’ll dive into the specific mechanics of reset windows for major providers like GitHub and Stripe, then move into implementing exponential backoff strategies that actually work. We’re covering everything from tiered OpenAI limits to the nuances of sandbox versus live environment throttling so you can build with confidence.
Key Takeaways
- Utilize a professional-grade API rate limit checker to simulate traffic spikes and identify exact throttling thresholds before they compromise your production environment.
- Master the anatomy of a 429 response by decoding standard headers like X-RateLimit-Remaining and X-RateLimit-Reset to predict exactly when your request window opens.
- Navigate provider-specific constraints, such as OpenAI’s dual RPM and TPM limits, to ensure your AI-driven automations scale without hitting unexpected walls.
- Replace high-failure “fixed” retry logic with professional-grade exponential backoff and asynchronous queuing strategies in platforms like Make.com and n8n.
- Protect your automation ROI by preventing cascading failures in nested workflows, moving from reactive debugging to proactive capacity management.
Table of Contents
- What is an API Rate Limit Checker and Why Does Your Stack Need One?
- Decoding API Response Headers: How to Read the Server’s Mind
- Comparing Rate Limit Strategies: OpenAI vs. Stripe vs. GitHub
- How to Use the Triumphoid API Rate Limit Checker for Stress Testing
- Mitigation Strategies: Handling Limits in Make.com and n8n
What is an API Rate Limit Checker and Why Does Your Stack Need One?
Testing in production is a gamble you’ll eventually lose. An API rate limit checker is a diagnostic utility designed to simulate specific traffic patterns, allowing you to identify the exact thresholds where a server begins throttling requests. It moves beyond static documentation by stress-testing your integration under real-world conditions. Understanding what is rate limiting at a foundational level is helpful, but the practical reality of 2026 B2B operations requires more than theory. You need to know exactly when your stack will break.
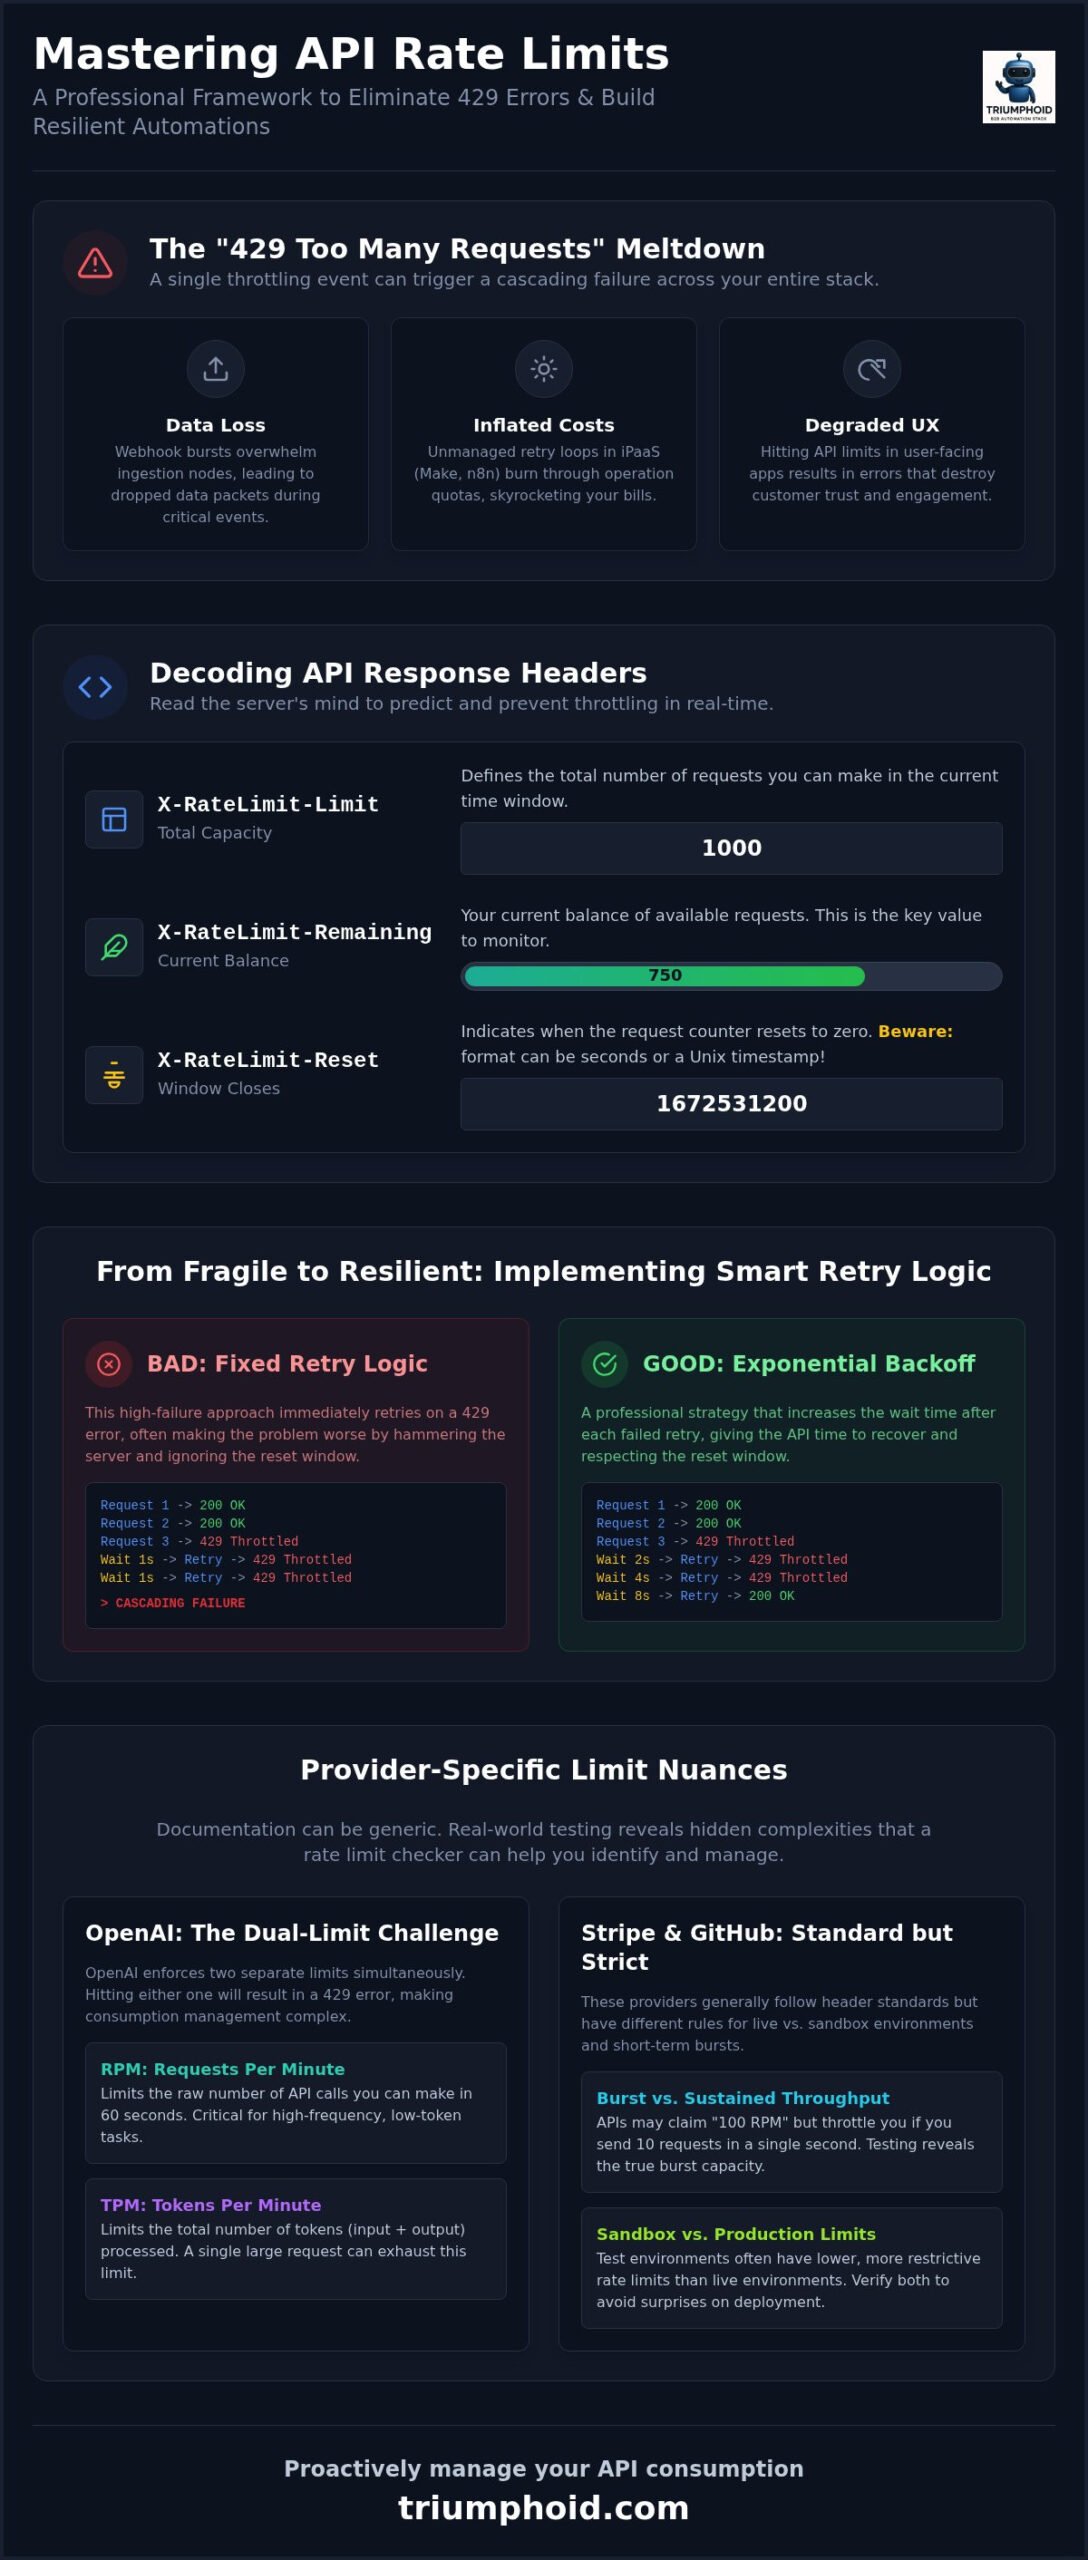
The cost of a 429 “Too Many Requests” error is rarely isolated, making a reliable API rate limit checker essential for any production-grade stack. In modern, nested automation workflows, a single throttling event can trigger a cascading failure across your entire infrastructure. If your CRM API throttles a request, your iPaaS might enter a high-frequency retry loop, burning through your monthly operation quota in minutes. This isn’t just a technical glitch; it’s a drain on your ROI. Standard documentation often provides a generic “requests per minute” figure, but these numbers are frequently misleading. They don’t account for concurrency spikes, payload size, or the “hidden” limits imposed by intermediary API gateways and security layers like Cloudflare.
Common Symptoms of Poor Rate Limit Management
Identifying the need for better consumption management often starts with recognizing the friction in your existing workflows. When your rate limits aren’t mapped, you’ll see these recurring issues:
- Data loss during webhook bursts: High-volume events, like a marketing launch or a bulk data sync, can overwhelm your ingestion nodes before they can process the data, leading to dropped packets.
- Inflated iPaaS costs: Platforms like Make.com charge for every execution. Unmanaged retry loops caused by 429 errors lead to massive, unnecessary bills that scale with your failure rate.
- Degraded user experience: If you’re building customer-facing AI applications, hitting OpenAI or Anthropic limits results in “Internal Server Error” messages that destroy user trust instantly.
The Role of a Rate Limit Test in Development
A proactive rate limit test is a prerequisite for any stable deployment. It allows you to validate the difference between “burst” throughput, which covers short-term spikes, and “sustained” throughput for long-term averages. Many developers find that while an API claims to support 100 requests per minute, it actually throttles if you send 10 requests within a single 100ms window. Stress testing your local n8n instances or Make scenarios before cloud deployment ensures that your logic includes the necessary delays or batching. This shift from simple “limit checking” to comprehensive “consumption management” is what separates fragile hobbyist automations from resilient, enterprise-grade systems.
Decoding API Response Headers: How to Read the Server’s Mind
A 429 status code is a blunt instrument. It tells you that you’ve been throttled, but it offers zero context on how to recover. To build resilient integrations, you must look past the status code and parse the metadata hidden within the response headers. These headers are the heartbeat of your connection. While many providers follow the de facto standards, others deviate significantly. Using a professional API rate limit checker allows you to visualize these headers in real time, turning cryptic server responses into a clear roadmap for your backoff logic.
Most modern APIs provide three critical headers to help you manage your quota. The X-RateLimit-Limit defines your total capacity within a specific window. X-RateLimit-Remaining is your current balance; it’s the number you need to watch to avoid the dreaded 429. Finally, X-RateLimit-Reset tells you when the counter goes back to zero. The challenge lies in the format. While some vendors provide the reset time in seconds, many use Unix timestamps. If your workflow doesn’t account for this distinction, your “wait” logic will either be dangerously short or unnecessarily long. Organizations like Stripe provide excellent documentation on how they handle these bursts, and reviewing Stripe’s API Rate Limits can give you a baseline for what “good” looks like in the wild.
Don’t expect every vendor to play by the rules. Shopify uses X-Shopify-Shop-Api-Call-Limit, while HubSpot often utilizes its own proprietary naming conventions. This inconsistency is exactly why manual debugging is a massive time sink. Our API rate limit checker normalizes this data, giving you a unified view of your consumption regardless of the provider’s naming quirks. It’s the difference between guessing your reset window and knowing it to the millisecond.
Understanding Rate Limiting Algorithms
The logic the server uses to throttle you determines how you should pace your requests. Most providers rely on one of these four patterns:
- Fixed Window: Limits reset at specific intervals, like the start of every minute. It’s simple but allows for “boundary bursts” where you can double your limit by hitting it at the end of one window and the start of the next.
- Sliding Window: A more equitable approach that tracks requests over a rolling timeframe. It’s harder to game and requires more precise client-side timing.
- Token Bucket: You have a “bucket” of tokens that refills at a steady rate. You can spend them all at once for a burst or save them for later.
- Leaky Bucket: Requests are processed at a constant, steady rate regardless of how fast they arrive. It’s the ultimate traffic smoother, turning erratic spikes into a predictable flow.
The ‘Retry-After’ Header: Your First Line of Defence
When you do hit a limit, the Retry-After header is your most valuable asset. It tells you exactly how long to wait before trying again. Some APIs return an integer representing seconds; others return a full HTTP-date timestamp. Your code must be flexible enough to handle both. The ‘Retry-After’ header serves as the authoritative instruction for client-side backoff, dictating exactly how long the requester must wait before attempting another call. Respecting this directive isn’t just about good manners. It prevents your IP from being flagged for aggressive polling, which can lead to longer, more severe bans.
Comparing Rate Limit Strategies: OpenAI vs. Stripe vs. GitHub
Scaling an integration requires understanding the specific resource your provider is protecting. An API rate limit checker reveals that throttling isn’t just about how many times you call an endpoint; it’s about the load you place on their infrastructure. Different vendors use vastly different enforcement logic to maintain their service level agreements. If you don’t account for these architectural differences, your code will fail long before you hit the theoretical limits listed in the documentation.
OpenAI introduces a dual-constraint system that catches many developers off guard. They enforce both Requests Per Minute (RPM) and Tokens Per Minute (TPM). You might stay well under your request limit but hit a wall because your payloads are token-heavy. Stripe, conversely, prioritizes transactional safety through high-concurrency limits. In live mode, you’re capped at 100 requests per second, while sandbox environments are throttled much tighter at 25 requests per second to prevent testing scripts from impacting production hardware. There is also the massive delta found in GitHub’s Rate Limits, where unauthenticated users are restricted to a mere 60 requests per hour, while authenticated accounts enjoy up to 5,000.
Distinguishing between ‘soft’ and ‘hard’ limits is vital for your scaling strategy. Soft limits often result in “de-prioritization” or slower response times, whereas hard limits trigger an immediate 429. Identifying these thresholds early prevents you from building a system that works in staging but collapses under real-world volume.
OpenAI Rate Limit Nuances
Your rate limit tier at OpenAI is determined by your lifetime spend. Moving from GPT-4o to the more computationally intensive o1 model drastically changes your available headroom. Limits are often enforced at the organization level. If two projects share the same API key or organization ID, one aggressive script can inadvertently throttle your entire production environment. Managing token usage proactively is the only way to avoid middle-of-request throttling, which often leaves your application in an inconsistent state.
Infrastructure Throttling: Cloudflare and WAFs
Sometimes the 429 isn’t coming from the API provider at all. Web Application Firewalls (WAFs) and proxies like Cloudflare often sit in front of the API, enforcing their own security-based throttling. This is where debugging gets complicated. A 403 Forbidden error might actually be a rate-based block disguised as a security violation. Our API rate limit checker helps you identify these proxy-level bottlenecks by analyzing response latency and header signatures that are unique to infrastructure providers. If you see a generic error page instead of a JSON response, your problem is likely at the firewall level, not the application level.
How to Use the Triumphoid API Rate Limit Checker for Stress Testing
Setting up a stress test shouldn’t feel like building a second infrastructure. The Triumphoid API rate limit checker is designed to streamline the diagnostic process, allowing you to replicate production-level traffic from the safety of your browser. Security is our baseline. Because the tool executes requests client-side, your sensitive Bearer tokens and API keys never leave your local machine or touch our servers. You get the data you need without the security audit headache.
Most developers make the mistake of testing with a steady, linear flow. Production isn’t steady. It’s erratic. Our tool allows you to toggle between linear growth and sudden traffic bursts. This is crucial for identifying how your provider handles ‘burst’ capacity versus ‘sustained’ limits. By simulating a sudden spike, you can see if the server’s response time degrades before the 429 actually hits. This gives you a ‘yellow light’ indicator for your own monitoring systems, allowing you to adjust your logic before a total shutdown occurs.
The results log provides a granular, request-by-request breakdown of every interaction. You can see exactly which header changed and when. If a server suddenly switches from a 50ms response to a 500ms response while still returning 200 OK, you’ve found your first bottleneck. Identifying the exact point of failure prevents you from over-engineering your backoff logic or, conversely, leaving money on the table by being too conservative with your request pacing.
Ready to stop guessing? Access the API rate limit checker now to stress test your integration for free.
Step-by-Step Diagnostic Workflow
Start by importing your production cURL command directly into the interface. This ensures your headers, body parameters, and authentication are identical to your real-world environment. From there, you can adjust the ‘Requests per Interval’ slider to find your breaking point. It’s a methodical process of escalation. Once you’ve identified the threshold, export the test data as a CSV to share with stakeholders or to inform your capacity planning for upcoming iPaaS migrations.
Interpreting the Triumphoid ‘Success vs. Error’ Chart
The chart visualizes the relationship between volume and stability. You’ll often see latency increases as you approach the limit, which is a clear sign the server is struggling to process your queue. You’ll also be able to spot ‘quantized’ rate limiting. This is when a server resets your quota in large blocks at the top of the minute rather than a smooth, continuous refill. Understanding this specific rhythm is the key to setting your concurrency limits in n8n or Make.com, ensuring you maximize throughput without triggering a ban.
Mitigation Strategies: Handling Limits in Make.com and n8n
Identifying your breaking point with an API rate limit checker is only the first step toward a resilient architecture. The real challenge is translating those diagnostic results into a robust error-handling logic within your iPaaS. If you simply set a “fixed” retry interval, you’re likely to hit the same wall repeatedly, wasting operations and potentially triggering a temporary IP ban. Professional-grade automation requires moving from reactive patching to a proactive, governor-style consumption model.
Exponential backoff is the industry standard for a reason. Instead of retrying every five seconds, your logic should increase the delay after each failure. This gives the server’s “leaky bucket” time to drain and prevents your workflow from contributing to a self-inflicted DDoS attack on your own API keys. Managing distributed throttling is equally critical. If you have multiple workflows across different platforms sharing a single API key, a local delay in one won’t stop the others from exhausting your quota. You need a centralized strategy, often involving a shared database or a global variable, to track remaining tokens across your entire stack.
Leveraging pre-built logic is the fastest way to implement these safeguards. Our team has developed specific API rate limit checker configurations that pair with our internal library of templates to handle these edge cases automatically. These tools ensure your production environment stays stable even when your traffic volume is anything but predictable.
Make.com (Integromat) Specific Tactics
In Make.com, the ‘Sleep’ module is a common but often misused tool. While it’s effective for minor pacing, it doesn’t handle actual 429 errors gracefully. For high-volume scenarios, you should configure the ‘Break’ setting in your error handling route. This allows the scenario to pause and retry after a specified interval without burning through execution cycles. You should also adjust your Scenario settings to limit sequential execution, ensuring that only one instance of a workflow runs at a time if the target API is particularly sensitive to concurrency. For a deeper dive into these configurations, see our Make.com Tutorial for advanced error handling.
n8n Enterprise Scaling Best Practices
Scaling n8n requires a shift toward asynchronous processing. Instead of a single, long-running workflow, use a queue-based system where one workflow receives data and another processes it at a controlled rate. The ‘Wait’ node is your best friend here, especially when you configure it to wait dynamically based on the X-RateLimit-Reset header you’ve identified during your testing. If you’re running self-hosted n8n, managing concurrency at the worker node level is vital. You can limit how many parallel executions a specific worker handles, providing a hardware-level throttle that complements your software logic. Check our n8n Workflow Templates for pre-built rate-limit logic that you can import directly into your instance.
Master Your Throughput and Scale with Confidence
Scaling B2B operations demands a transition from reactive debugging to proactive architectural planning. You’ve learned how to decode complex response headers and navigate the specific throttling logic used by major providers like OpenAI and GitHub. Using a dedicated api rate limit checker allows you to map these constraints with precision, ensuring your n8n or Make.com workflows are built for real-world volatility. This level of visibility is the only way to protect your ROI and prevent cascading failures across nested automations.
You shouldn’t have to guess when your reset window opens or when a burst will trigger a ban. We’ve developed a professional-grade tool specifically for B2B Ops Engineers who need results without the friction. It features a zero-data-retention policy and requires no login, executing entirely in your browser to keep your API keys secure. Try the Free API Rate Limit Checker on Triumphoid to identify your breaking points and optimize your consumption today. You’ve got the framework; now it’s time to build integrations that never break.
Frequently Asked Questions
What is the difference between a rate limit and a quota?
A rate limit measures velocity, while a quota measures total volume. Rate limits restrict how many requests you can send in a short burst, such as 100 requests per minute. Quotas are long term caps, like 50,000 requests per month. Exceeding a rate limit triggers a 429 error that resets quickly; exceeding a quota often requires a billing tier upgrade or waiting until the next month.
How do I find my API rate limit without a tool?
You can find your limits by inspecting the HTTP response headers of a successful API call using cURL or your browser’s developer console. Look for headers starting with X-RateLimit. If the provider doesn’t include these in the response, you’ll have to dig through their technical documentation, though these numbers are often generic and don’t reflect account specific tiers.
Why am I getting a 429 error even though I am below the limit?
You’re likely hitting a “burst” limit or an infrastructure throttle. Many APIs allow 1,000 requests per minute but will block you if you send 50 of those in a single 100ms window. Intermediary layers like Cloudflare or a Web Application Firewall (WAF) can also trigger a 429 based on suspicious traffic patterns before you ever reach the application’s actual limit.
Can I bypass API rate limits using a proxy or VPN?
Proxies only work if the limit is tied strictly to your IP address. Most modern B2B APIs tie limits to your API key or Organization ID. In these cases, rotating your IP address won’t help because the server identifies you by your credentials. Attempting to bypass limits this way often results in a permanent account ban for violating terms of service.
What is the ‘Token Bucket’ algorithm in simple terms?
Think of a bucket that refills with tokens at a steady rate. Every request you make costs one token. If the bucket is full, you can send a burst of requests all at once. Once the bucket is empty, you have to wait for it to refill before you can send another request. It’s a flexible system that allows for occasional spikes while maintaining a stable average.
How does OpenAI calculate ‘Tokens Per Minute’ (TPM) limits?
OpenAI calculates TPM by summing the tokens in your prompt plus the value you’ve set for max_tokens in your request. It doesn’t matter if the model actually generates fewer tokens; the system “reserves” the maximum amount as soon as the request is received. If this total exceeds your current minute’s headroom, the request is blocked immediately.
What should I do if my API provider doesn’t return rate limit headers?
You’ll need to use an api rate limit checker to experimentally determine the threshold. By running controlled stress tests with increasing request frequency, you can identify exactly where the 429 errors begin. Once you find that “breaking point,” you can build your own client side governor to pause requests before the server forces a shutdown.
Is it safe to enter my API key into an online rate limit checker?
It’s only safe if the tool is browser based and executes requests client side. Many online tools send your keys to their server to process the request, which is a major security risk. Our api rate limit checker runs entirely in your browser. Your keys never leave your local environment, ensuring that your sensitive credentials stay under your control at all times.